


Hi 👋 welcome to Recompound Blog - The Investment Mindshift. We help you better your mindset on investment and economics one article at a time. More: Advisory | Get to know us
This is part III of Indo Stocks that was promised in part I. If you missed the first part where I talked about weakening currency of Indonesia against USD overtime, head over using this link. If you miss the second part about market manipulation, here it is.
Now this is going to be a super real, but obvious, statement. Corruption in the Indonesian government exists. We have to accept this statement no matter how we want to frame it. I mean, it is just one chatgpt away folks.
To name a few highlights:
Orde lama - Pertamina, Indonesia's state-owned oil company, was implicated in significant financial mismanagement and corruption. The company's director at the time, Ibnu Sutowo, was accused of misusing funds and accumulating massive debts, which severely impacted the national economy.
Order baru - Suharto’s regime was marked by pervasive corruption, with estimates suggesting that he embezzled between $15 to $35 billion during his 31-year rule. This corruption permeated various sectors, involving cronyism and nepotism that benefited his family and close associates.
Reformasi - The bailout of Bank Century during the global financial crisis involved the disbursement of approximately Rp6.7 trillion (around $710 million). Investigations uncovered that the bailout funds were misappropriated, leading to public outcry and legal proceedings against several officials.
Jokowi Administration - Jiwasraya Scandal (2018): State-owned insurance company Jiwasraya was involved in a corruption case that resulted in state losses of approximately Rp16.8 trillion. Asabri Scandal (2019): Similar to the Jiwasraya case, the state-owned insurance firm Asabri was embroiled in corruption involving mismanagement and fraudulent investments, leading to estimated state losses of around Rp22.78 trillion.
Prabowo Administration - Went full circle to Pertamina facing allegations of adulterating subsidized petroleum with non-subsidized petroleum, leading to estimated state losses of approximately Rp968.5 trillion (equivalent to around $58.94 billion).
Above are famous highlights that we might probably have heard. I am sure that there are more corruption scandals that have not been surfaced or pursued yet. The key thing to ask is that, does that mean that we have to #kaburajadulu (for non-Indonesian readers: flee the country first) because the government is not trust worthy at all? Or should we even propose anarchism as an alternative to a governmental system that uses violence and taxation to exert control in a jurisdiction?
Now to answer the #kaburajadulu folks, if the reason for fleeing the country is because of the corrupt government, why now? Why not since during the SBY era? Or the Suharto era? For one, the decision to flee a country is exceptionally personal. However, I think it boils down to very practical reasons ranked in order:
Physically unsafe due to war or other humanitarian crisis (this is self explanatory)
Physically unsafe to stay in a jurisdiction due to violence against a certain ethnic, or religious groups. Check out racial genocides like:
Sri Lanka,
Germany,
Northern Ireland,
Rwanda and many more
Extremely corrupt government that leads to severe economic mismanagement. Misappropriation of tax payers’ money is known to cause severe economic trouble (crazy high inflation, huge unemployment, etc) which adversely impact livelihoods of many. A prominent example is Venezuelan government under the presidency of Nicolas Maduro where corruption and economic mismanagement is super pervasive. Google for more info.
Extremely bleak economic prospects. The difference between this point and #3 is that right now the economy is still fine. But the prospect is incredibly bad.
Evaluating the practical reasons
#1 and #2 are obvious. If there’s physical violence and is practically super unsafe in an area where you live, you might want to consider reallocating because humans (or living creatures in general) are built to survive.
#3 gets slightly tricky. How corrupt do you need the government to be to declare your intention to leave the country? How much of an economic calamity do you and your family need to experience to explore other jurisdictions for a better livelihood?
For one, the 1MDB scandal already happened in Malaysia and it is controversial as Jho Low (the mastermind) enabled misappropriation of ~$4.5 billion of funds. So much so the then Prime Minister Najib Razak was convicted and sentenced to 12 years in prison. It is gross to see government officials use taxpayers’ money for their own benefit. However, I don’t see Malaysians fleeing the country in the wake of the scandal. They were rightly so outraged about it and therefore they voted Mahatir in the subsequent election.
For Danantara, the reported amount of funds that has been misappropriated is $0 so far.
If Malaysians don’t seem to flee the country, why are Indonesians super worked up and already conclude that they have to flee the country right now?
Let’s investigate this question and see if the fear is imaginary or real.
Because no matter how we spin it, there must be a reason why people are fed up by the government and to decide to leave the country altogether. And for the #kaburajadulu folks, it seems that #4 is the reason. Hence, they might think that:
Government is super corrupt, therefore
Real economy is going to be super bad (or it is already bad and will be even worse in the foreseeable future), therefore
there is no point staying in Indonesia as their livelihood is likely going to be super bad (maybe as bad as that in Venezuela)
Fear #1: Government is super corrupt
I have to admit that this point is quite tricky. Because the nature of corruption is that it is not transparent. So naturally it is difficult to get a good hand of the actual data of corruption levels. I also feel that trying to answer how corrupt the government would usually end up in an endless debate (or what we always like to say: debat kusir).
Why? The data is the same: there is corruption by government officials. However, the belief is vastly different. “is the level of corruption acceptable?” entirely depends on your belief as illustrated in the diagram below.

For example, if you invite fictional characters: Budi, Toby and Wilson to look at the corruption perceptions index below
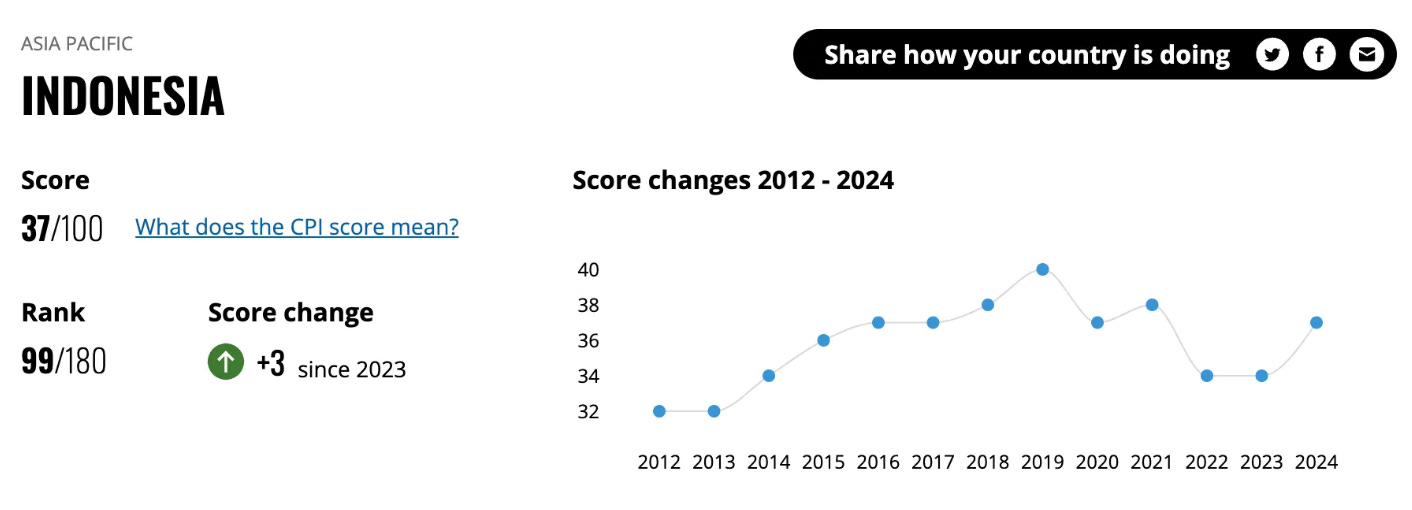
All three of them will agree that there exists corruption in Indonesia. And maybe it is bad because the score is below 50 (the closer you get to 100, the better you are as a country).
However, Budi will say:
“it is an uptrend since 2012 🤩 that means Indonesian government will be less corrupt!!“
Then Wilson will say:
“it seems that it is not going anywhere.. 😕”
Toby will say:
“it is a dead cat bounce! It will hit 10 soon just like Venezuela. Kabur aja dulu!! 😡”
You can imagine that the debate is pointless and there will not be any resolution. Outcome of the conversation will depend on who shouts the loudest. Therefore, notice how the underlying data is exactly the same, but the opinion that arises from that data can be vastly different depending on the prevailing narrative that is propagated.
Fear #2: Economy is going to be super bad
To be fair I don’t know how bad the economy is going to be in the future. You can ask a proper economist who can model out the macroeconomic outcome based on studied variables. But if you ask a random person on social media to predict the economy, maybe they might be biased based on the recent content they consumed.
But let’s assume that the government is suuuper corrupt. The fear is going to be about how bad the economy is going to be in the wake of a super corrupt government.
Again, I don’t claim that I can predict the future, but I do believe we can see what is the macroeconomic data like in the past when there is corruption.
So in light of fear #1 and fear #2, lets get down to the macroeconomic data where everyone will have more common ground to look at it more objectively.
Let’s dive right in. When reading the below data, it helps if you (yes you the kind reader) picture yourself as the president of Indonesia.
APBN (Indonesia’s state budget)

Recall SBY was in power in 2004 - 2014. Jokowi was in power in 2014 - 2024.
The blue bar chart is the state income and the orange bar chart is the state spending. If state spending is larger than state income then we have a surplus. If state spending is less than state income then we have a deficit.
Notice that during Jokowi’s period the deficit is much more compared to that during SBY’s period.
To put in exact nominal term,
SBY 10 year: ~Rp 91T per year
Jokowi 1st period: ~Rp 300T per year
Jokowi 2nd period: ~Rp 650T per year
Note I distinguish 1st and 2nd period of Jokowi because of COVID in 2nd period.
Yes, state spending would understandably be higher during COVID period compared to income because of the reduced economic activities and the need for the government to compensate to bring more economic stability. That’s why you could see that the the deficit in 2020 and 2021 (during massive lock downs) went as high up as 58%. Like it or not, the government experienced a force majeure during the pandemic and had to take measures to prop up the economy.
So is the deficit good or bad?
We can’t really see the data like that and conclude that it is good or bad. A budget deficit usually means a more aggressive action by the government to spur economic growth. It can, however, be a problem down the line if the state’s debt becomes too high to manage. So in view of the deficit, the key metric to look at here is debt.
Debt Situation
Debt interest payment ratio to government revenue sees an uptrend

We have to admit that this is not good. We could see that in the SBY era, the theme was more of deleveraging when he started with a higher debt interest payment ratio of 17% in 2004 and he brought it down to 7.9% in 2013.
During Jokowi’s era, he was trying to be more expansive by increasing government debt and hence interest payment also increased. Initially we think that the increase was manageable hovering at 10 - 14%.
However, he got into an accident because of COVID and the government debt payment ratio increased quite notably in the 2020s.
Side note:
If you buy a Fixed Rate or SBN and receive coupons from the government, that money you get is what contributes to the chart that you are seeing. I like to keep things more relatable so you know what we are talking about 🙂
While the debt levels relative to government income might not be in the best place, how about the debt levels relative to GDP and more importantly interest expense relative to GDP?

As seen in the chart, debt levels relative to GDP saw an increase to 39% from 26% at the start of Jokowi’s administration. But it is relatively comparable to the levels seen at the start of SBY’s administration. More importantly, interest expense to GDP ratio remains roughly stable between 4 - 6% for 20 years.
This tells us a number of things:
GDP growth seems to be offsetting the increased debt levels
More domestic debt vs foreign debt because currency depreciation can affect debt levels in Rupiah terms
Based on the debt levels alone, you might not be seeing something that is extraordinary. You would be correct in perceiving that Jokowi’s era is more expansive than Prabowo’s era. But not a doomsday scenario because you could argue that the debt levels are still manageable. If you compare this figure to let’s say Venezuela, the debt to gdp ratio over there has been consistently above 100% for the last 5 years.
But we cannot let our guard down and we have to ask ourselves:
Question #1: What is the debt used for? Is it used well?
The debt is used for building of infrastructure and arguably, it is not used very well. Let’s take a look at the graphics below.
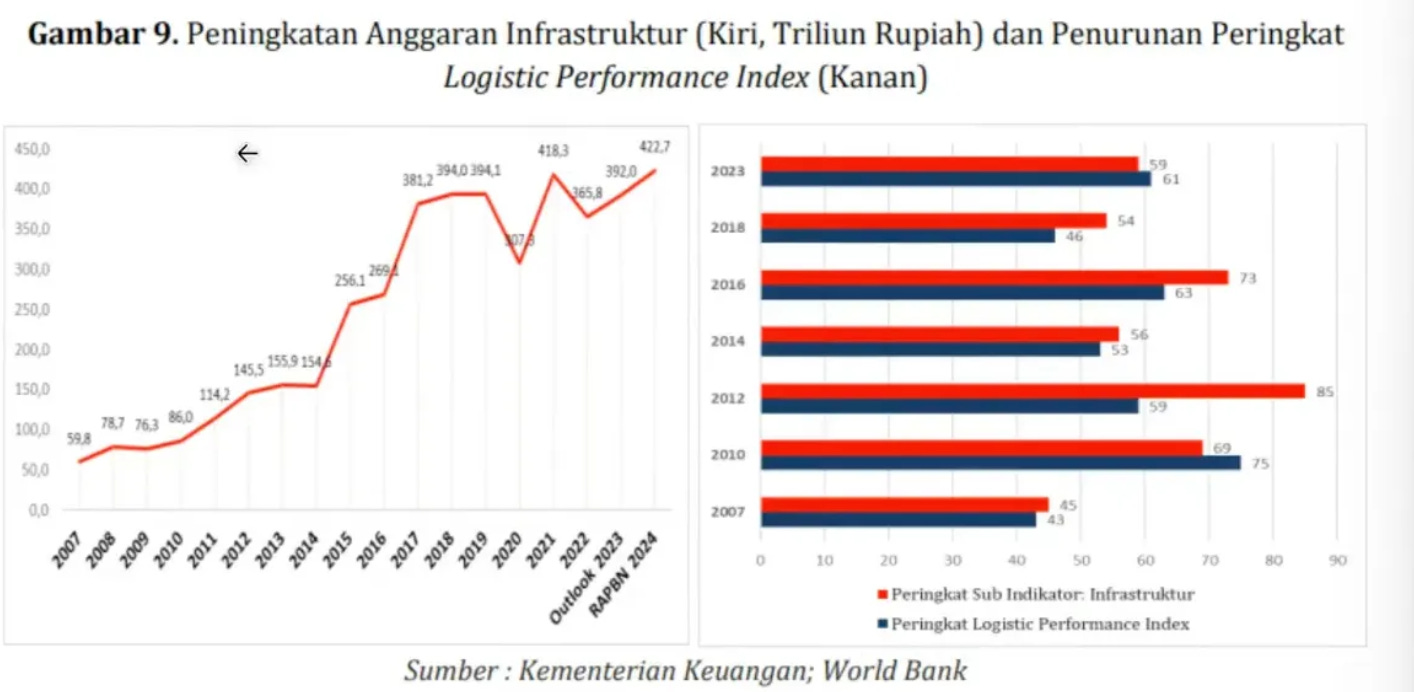
You could see that the budget for infrastructure went up in the chart above which signifies more spending for building of infrastructure. That is why you have state owned enterprises (SOEs) building toll roads, airports etc for better economic mobility in the hopes of promoting economic growth.
However, as the chart on the right indicates, the logistic performance index worsens in terms of ranking. It used to be top 50 in 2007 and now it is only top 60 recently in 2023.
So let us be fair in saying that: no, the debt could have been used better.
We also know that many SOEs have very high levels of debt to equity ratio (DER) in their financial reports. There are cases of PT Waskita karya, PT Wijaya Karya, etc undertaking plenty of debt restructuring to address their financial strains and to ensure it’s operational sustainability. This poor GCG, I believe, leads to the chart we see above.
While we don’t know if the situation is going to worsen, there are signs that it can be better through privatisation. For example, as of the first half of 2024, Astra International controlled 396 km of toll roads and is actively seeking to add more concessions.
We also need to bear in mind that poor execution of infrastructure projects do not have to always mean that central government is severely corrupt. It is incredibly difficult to manage corruption at the grass roots levels as well. How do you deal with corruption happening at procurement level? Or financing level?
Lastly, despite the not so ideal outcome of the government spending in infrastructure, infrastructure still got built during Jokowi era, espeically toll roads. Approximately 2000km of toll roads was built which accounts for 70% of the length of the Indonesia’s toll network.
Conclusion: yes execution is meh leaning to poor. But results is not 0 and there is a way to fix this.
Question #2: What is the driver of GDP growth like?
The 20 year GDP growth rate is as follows.

We can see that the country is still growing and has roughly recovered from recession that was caused by pandemic. But this tells us nothing about the driver of growth and we have to look at other metrics to get a better picture.
I think a nice way to look at the type of GDP growth is to look at the tax revenue overtime and tax ratio to GDP as shown in the graph below.

Tax is a big part (80%) of government’s revenue and we could see that it has been growing. However, the tax ratio sees a decreasing trend from 12 - 13% during SBY’s era to around 10% in Jokowi’s era. The ratio in 2023 is 10.2% and the ratio in 2024 is 10.1% (finding data is hard).
What does this mean?
First, decreasing in tax ratio compared to GDP means that there is an increasing “informal sectors”. When we have smaller guys doing business, it follows that collecting taxes from them is more difficult. This is because if profit margins from small enterprise might only be slightly above their living expense, then the small enterprise owners would be more likely to avoid tax for survivability. This might mean that growth is less inclusive if we see an increase in informal sectors. For example, they might not be compliant to minimum wage laws and other employee benefits that are governed by law.
Second, we have seen that there is a decrease in corporate tax from 30% (in 2005 - 2008) to around 22% (in 2020 until present) in Indonesia. This is perfectly understandable given that Indonesia needs to attract foreign direct investments (FDI) as a source of growth. Therefore, the tax ratio to GDP sees a downtrend. And indeed, we can see that there is an increase in FDIs in the last 5 years which I think is good in promoting economic growth and stabilising foreign exchange.

Therefore, we could see that the driver of growth for the economic growth is likely to be growth in informal sector (which I think is not good) and growth in FDIs (which I think is good).
Closing Remarks: Is the Indo Government Trust Worthy?
I hope that this article gives you a more grounded picture of performance of Indonesia as a country for the past years. There you have it, the macroeconomic data. It could be interpreted as simple as SBY was conservative and Jokowi was aggressive in pursuing economic growth.
Or it could be interpreted as Indo government is extremely corrupt and we should flee the country. However you want to interpret it, that is the data and you conclude yourself if the Indo government is trust worthy or not.
For me, I am not saying that Indonesia’s macroeconomic performance is exceptionally stellar and brilliant, but it is also not exceptionally bad either. Especially considering that Indonesian government needs to deal with rampant corruption that hinders growth.
As things stand right now, we are definitely not as clean as the Singapore government or maybe you could be called delusional if you think that Indonesian government will be as clean as the Singapore government, ever. But I think it is vastly pessimistic to call out the Indonesian government to be as corrupt and inept as the Venezuelan government.
As investors ourselves, our job will then be to ask ourselves:
Could you find a company in Indonesia that can have a long term growth of more than 3%?
Because if you can’t find a company that could grow higher than that rate, you are better of just holding USD. If you can though, why not just invest and go for the higher returns?