
Our Favorite Technical Analysis Indicator
Spoiler: it isn’t RSI / MA20 / MA200 / MACD / Ichimoku / Kijun / Cup and Handle / Head and Shoulders / Spinning Top / Three White Soldiers / Three Black Soldiers

Hi 👋 welcome to Recompound Blog - The Investment Mindshift. We help you better your mindset on investment and economics one article at a time. More: Advisory | Get to know us
This is not another draw more lines post
If you skim the title, you might assume we’re about to mention yet another price-action tool.
I get it. I’ve been in the market since 2019 (~6 years).
For my first two, I traded heavily with technical indicators.
I stacked so many indicators that my screen looked like a NASA command center:
The result? My portfolio didn’t really grow.
Wins on some tickers just papered over losses on others. Frustrating is an understatement.
After a lot of head-scratching (and a few portfolio bruises), a senior mentor shared an uncomfortable truth:
In a shallow-liquidity market like Indonesia, price action can be… pushed around easily.
No, don’t worry it’s notmanipulated😉 (sarcasm mode).
Market makers know exactly which technical indicators retail investors love, precisely because using them is much easier than doing real fundamental work—reading financial statements, public exposes, annual reports, , forecasting earnings, forecasting industry-wide growth, scuttlebutt (a.k.a cek lapangan) and valuing businesses.
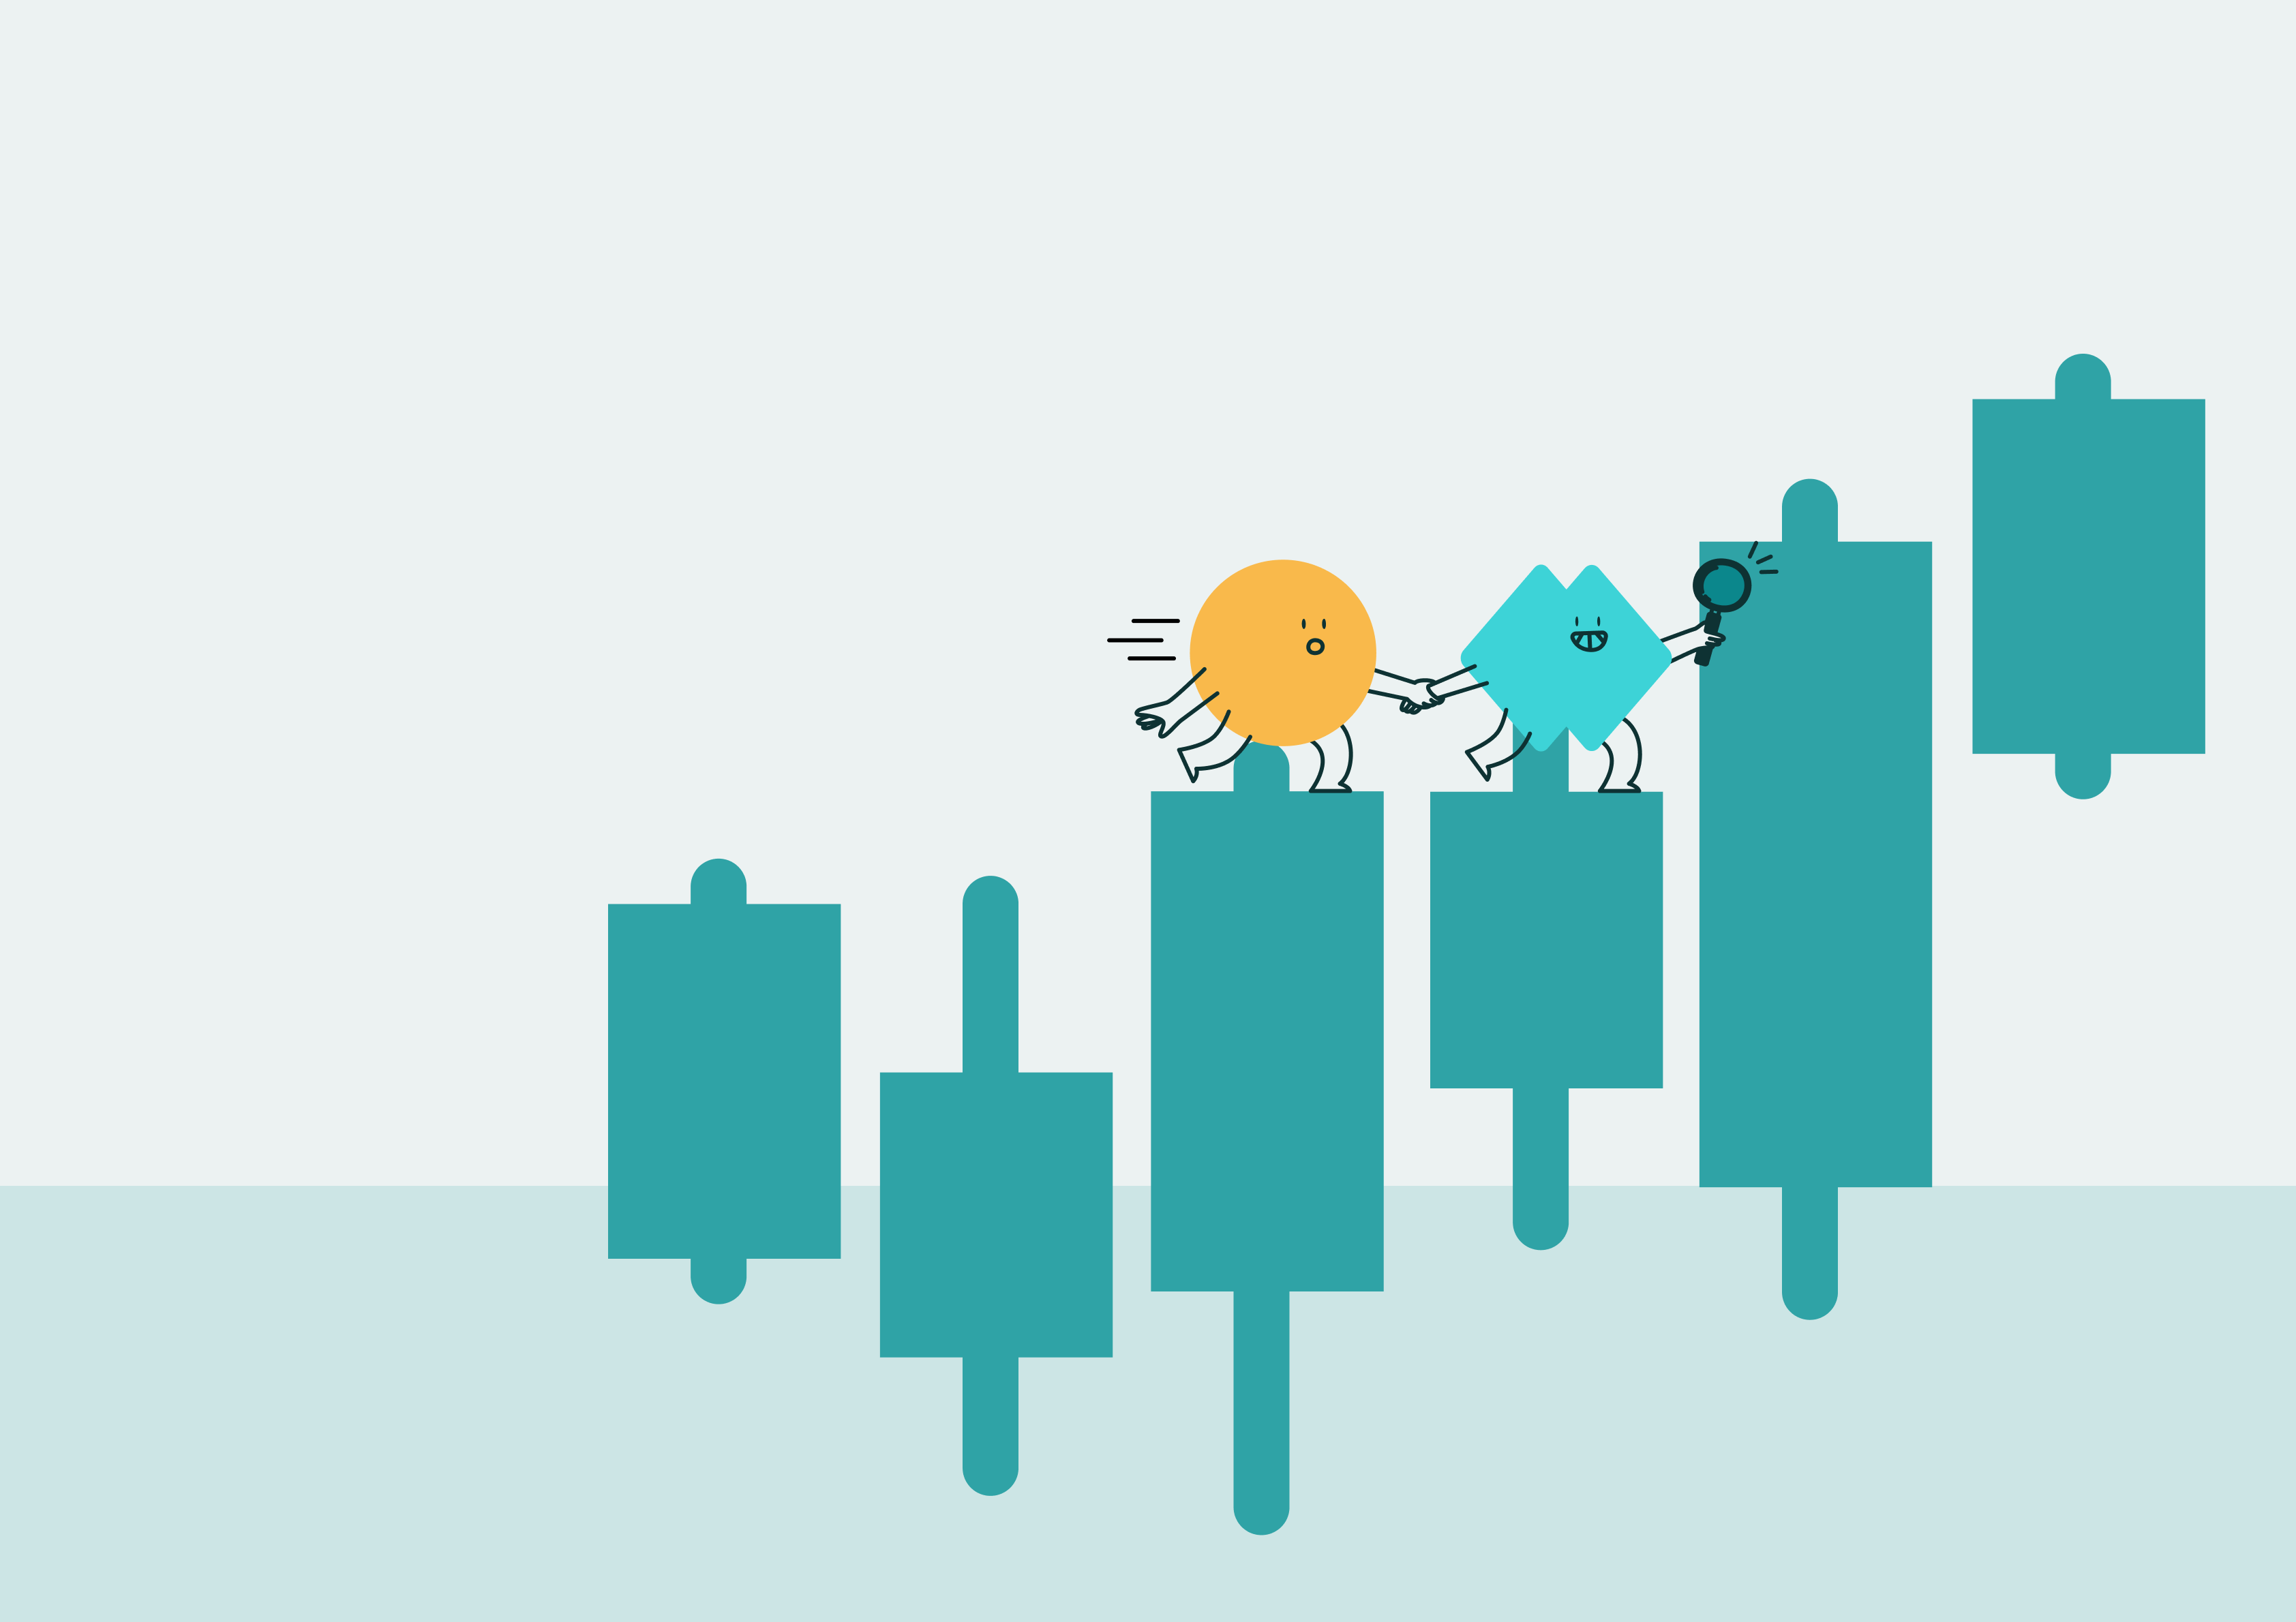
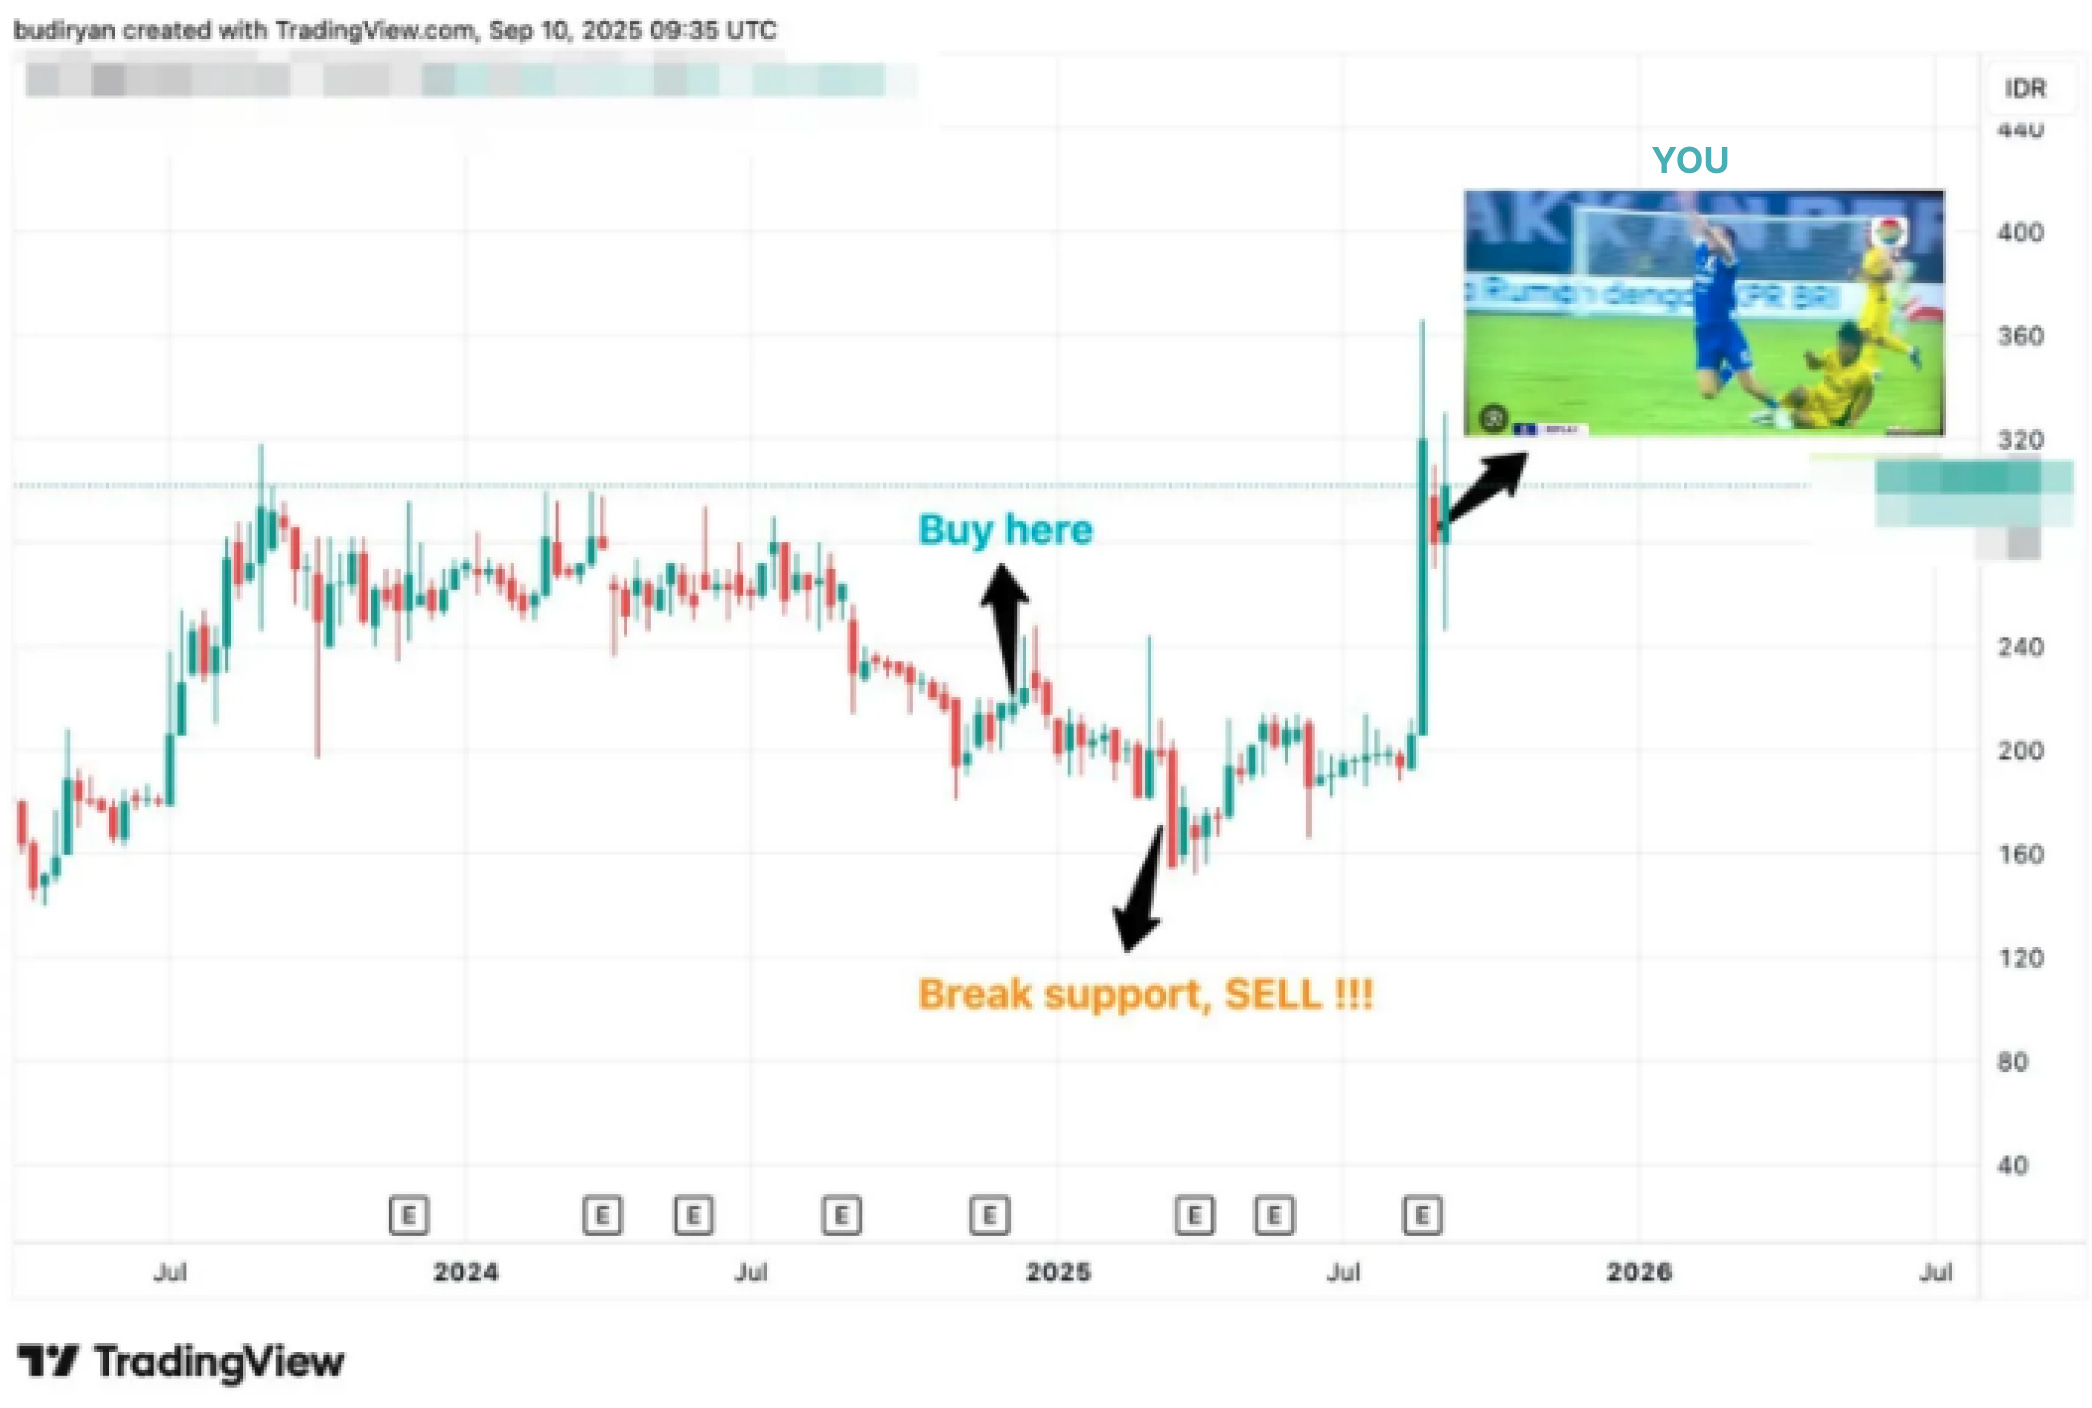
That’s how many retail investors end up kena gocek (got Cristiano Ronaldo-ed). You’ve seen it:
A stock “holds support” for months… until it doesn’t. It breaks for a few days, flushes out the support-and-resistance crowd, then rips back above the box to start moving like a rocket ship up.
“Okay, then I’ll just buy breakouts.” Not so fast—some breakouts are designed to be fake. Price pops above the range, sucks in momentum chasers, then drops back into the box before the real rally happens.
At some point I realized:
If price is easier to be “pushed around”, then tarik-tarik garis (drawing lines) isn’t the edge, for me at least.
For me what has worked so far is to understand the crowd.
Our favorite TA indicator: psychology
We treat psychology as an indicator—specifically the emotions of the crowd.
The market doesn’t react to news. It reacts to whether the news are better or worse than what everyone already expected (fear and greed). Prices often reflect the extreme before the news catch up.
Legendary investors (Peter Lynch, Howard Marks, Warren Buffett and others) have said this for decades in one form or another: when the crowd’s emotion is peaking, the risk–reward flips. Doing the opposite of the crowd at extremes is often where the best opportunities live.
TL;DR
Our favorite “technical” indicator is not on the chart. It’s in the crowd: fear vs greed.
A recent case study: April 2025 market crash
In early April 2025, a series of headlines hit at once.
Global tariff proposals from Washington met domestic pessimism — Danantara, RUU TNI, Indonesia Gelap movement, and debates around the early Prabowo policy direction. That cocktail created a confidence shock.
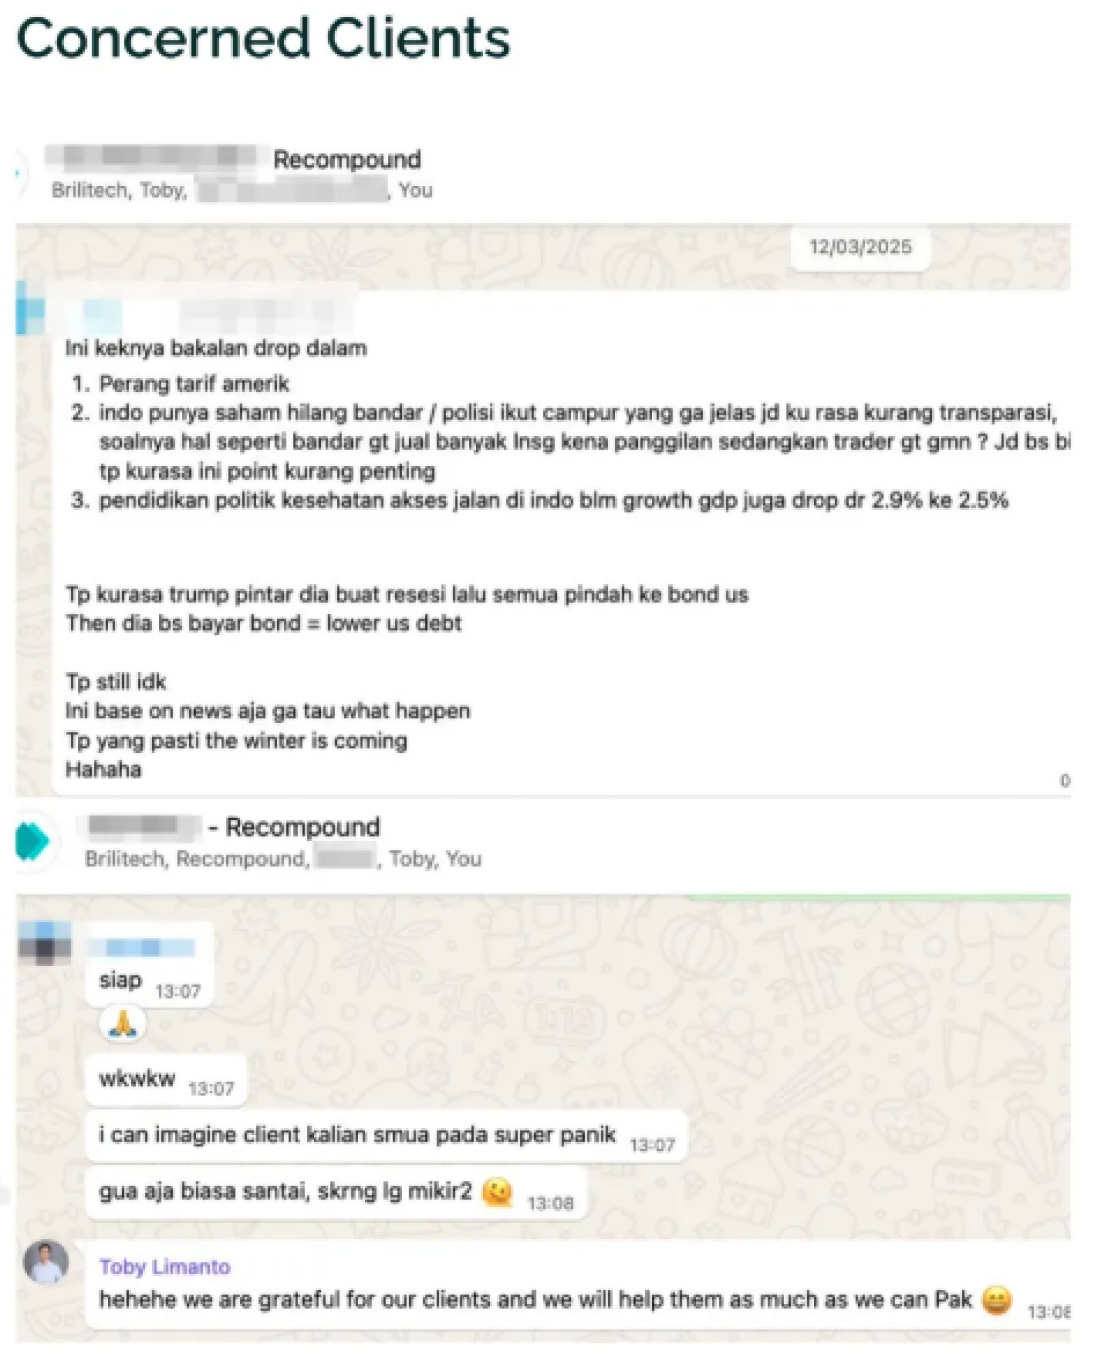
Back home, IHSG hit trading halts to stem the decline. Retail sentiment tanked.
Our WhatsApp groups lit up with worried messages from clients.
And then… the rebound. From the low, IHSG jumped ~18% within roughly six weeks.
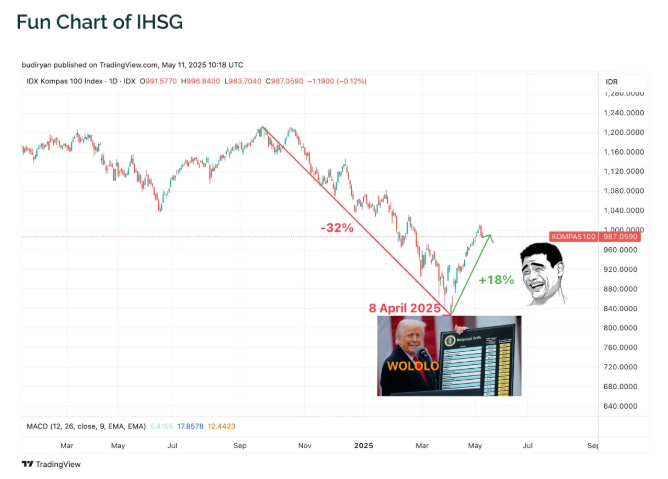
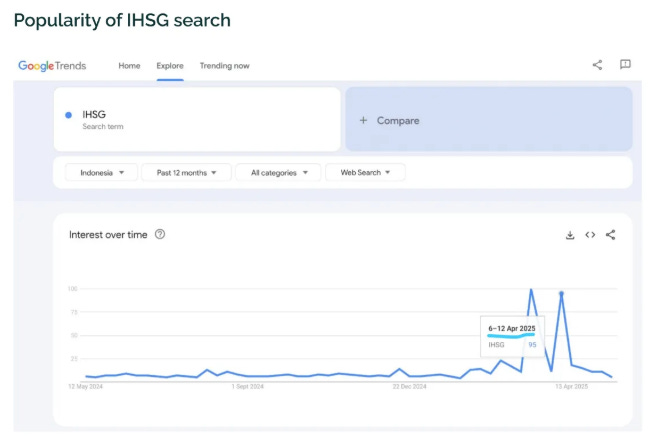
Interestingly, the bottom coincided with a spike in Google searches for “IHSG”. When everyone starts googling the index, it usually isn’t because they feel zen. It’s because they’re panicking.
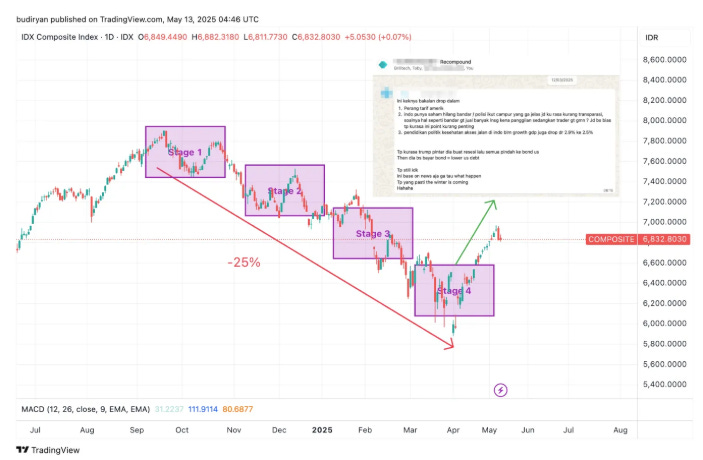
What this suggests:
News lag price. Capitulation shows up on the chart before the news headlines.
Fear clusters. You see it in client messages, mainstream headlines, and search interest—often right near market bottom.
Peak pessimism (market bottom) did not happen on stage 1 - 3. It happens on stage 4.
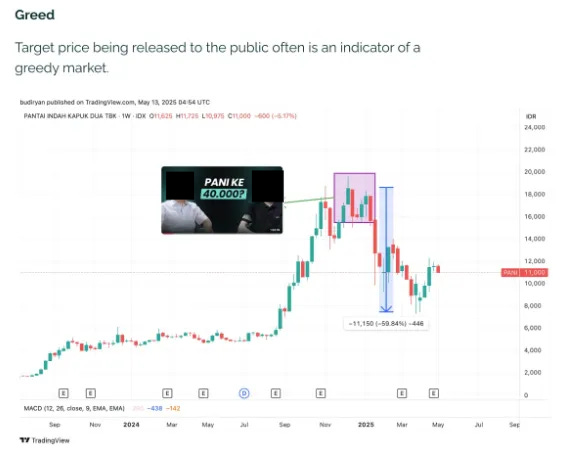
The other side of the same pendulum: greed
The same logic applies at the top. When target prices get blasted everywhere for public consumption, it often hints at a greedy tape.
One example shows a widely discussed target followed by a deep drawdown. We’re not calling out individuals here; the point is the pattern: public, consensus it can only go up targets often mark late-cycle exuberance.
But don’t use psychology alone
This isn’t a license to bottom-fish every dip or fade every rally.
Psychology helps with timing, but fundamentals drive value.
Our process always goes back to our core framework:
👉 recompound.id/handbook/how-we-invest
We use crowd sentiment to optimize entries and exits—never to replace the real work.
How we actually read the crowd (our checklist)
When fear is peaking (high probability the market / a stock is bottoming):
Listen to peers. Are your friends suddenly starting to sell everything ?
Scan headlines. Are the news absolutist (end of X, never again Y) ?
Watch search interest. Do Google Trends for key tickers or the index spike ?
Look for market capitulation signatures. Example: Trading halts !
When greed is peaking (high probability the market/ a stock is peaking):
Public target-price parties. When everyone’s sharing sky-high targets on TikTok, Instagram, YouTube, Stockbit forums or WhatsApp group chats, we’d like to be more cautious.
Family BBQ indicator. A relative or friend who’s never invested suddenly gives you hot stock tips. Late-cycle FOMO alert.
One-way narratives. “This time is different,” “no pullbacks ahead,” “easy money baby !!!”
Tying it together
If price action can be pushed around, your edge likely will not come from drawing ever more perfect lines.
It comes from understanding the humans behind those candles—and then combining that read with disciplined fundamental work.
So yes, our favorite “technical analysis” indicator is… psychology.
Buy when others are fearful—in quality names, far below its intrinsic value.
Sell / Trim when others are greedy—especially when targets are on every social media thumbnail.
Always within the guardrails of our framework
Observing market psychology is one of key learnings at Recompound.
If you are curious and are eager to learn more about investing that really makes money sustainably over the long run,
We have condensed all of our learnings into bite sized lessons for 30 days.
Follow this link to access it for free.