


This article is provided for educational and informational purposes only and does not constitute financial, investment, legal, or tax advice, nor an offer or recommendation to buy or sell any security or financial product. The views expressed are those of the author as of the date of publication and may change without notice.
While the data and sources referenced are believed to be reliable and accurate at the time of writing, no representation or warranty is made as to their completeness or accuracy. Past performance is not indicative of future results. Investing involves risk, including the possible loss of principal. Before making any investment decision, you should do your own research and consult a licensed financial professional who can assess your individual circumstances, objectives, and risk tolerance.
Here we go! Btw I am running a marathon (basic). You can check it out after you finish this article.
Revisiting Law of Demand
Let’s forget finance for a second and let me take you back to week one of Economics 101. Maybe you might think: demand and supply. Well clearly you are an overachiever. We will be talking about demand. Just demand.
Now the law of demand says: when the price of a good increases, the quantity of goods demanded falls. Price up, buyers would stop buying the good as much.
But how much would the quantity demanded be falling if the price increases?
By a lot?
By a bit?
or in proportion?
Now the “how much” is what economists call elasticity of demand.
If the quantity demanded falls sharply as the price rises, the good is elastic. If the quantity demanded barely moves as the price rises, the good is inelastic.
And what usually determines elasticity is this: substitutability (blah very hard to pronounce).
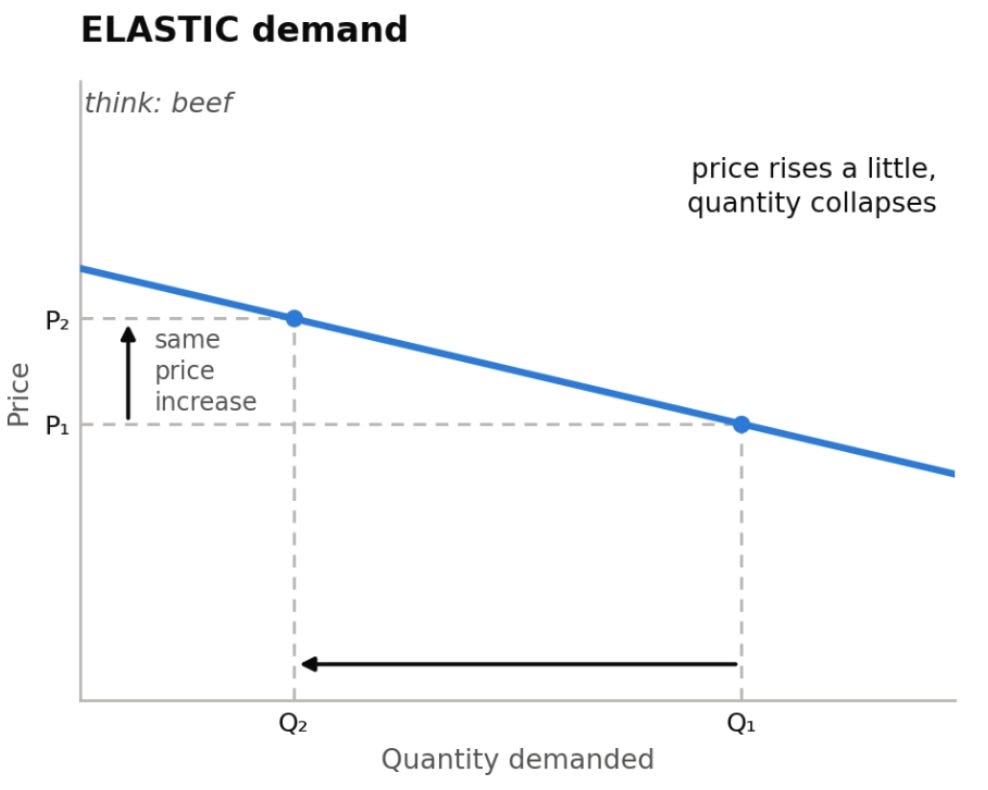
If a good has plenty of substitutes, its demand is elastic. For example, if the price of beef increases, people can simply switch to chicken, so the quantity demanded for beef collapses. To visualize:
But if a good has no real substitute, its demand tends to be inelastic.
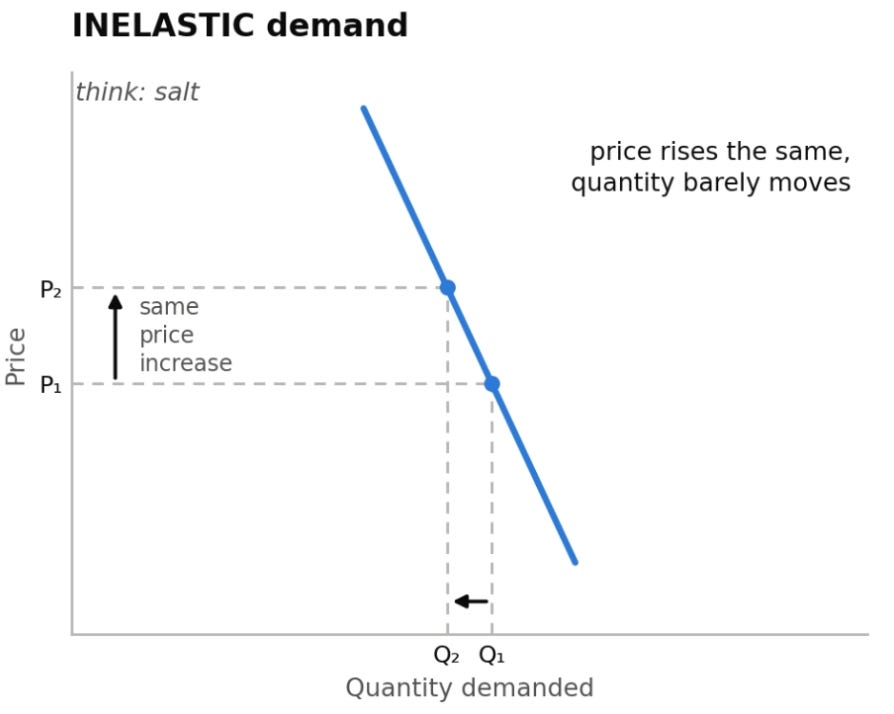
The textbook example of an inelastic good is salt. Let’s say tomorrow the price of salt doubles, people will whine a bit but they will still buy the same amount. Nothing else does what salt does, and nobody quits salt because it got expensive. To visualize:
Which leads to a naturally interesting question, doesn’t it?
An S&P 500 index fund is also a good that you can buy. So… is it elastic, or inelastic?
And why does it matter?
It is inelastic
Unlike shares like Apple that has obvious substitutes: if Apple looks expensive, you can buy Microsoft, or Google, or two thousand other companies. S&P 500 is structured differently. Because it attempts to help you buy equities as a whole, not just this stock or that stock.
If your money is programmed to buy equities as an asset class, there is not many substitutes that are quite like it so its inelasticity is intuitive.
But how inelastic?
Smart economists have measured exactly this. Xavier Gabaix (Harvard) and Ralph Koijen (Chicago) put a number on it in a paper titled *The Inelastic Markets Hypothesis.* They found that aggregate demand for stocks is so inelastic that every $1 flowing into the market pushes up total market value by roughly $5.
Furthermore, follow-up research shows the market has been getting more inelastic as the years progress, decade after decade.
Mind boggling isn’t it? Especially the follow up research. How is it gotten more and more inelastic over the years?
Because why won’t the active funds exploit the increasingly inelastic behavior of equities as an asset class? If there’s blind money that buys up assets without looking at the price, smart money should instantly sell to that overpricing. That’s just how the market is supposed to work, in theory.
But S&P500 behaves more and more like salt in practice.
Rise of passive index funds
In 2000, roughly $1 in $10 in US stock funds was indexed. Today it is roughly $2 in $3. In fact, passive funds crossed the 50% line in 2019, when index fund assets overtook active for the first time (~$4.3T each in US equity funds),
On the other hand active investors, according to Haddad, Huebner & Loualiche is on the decline. They measure price-checking active investors at 78% of the US market in 2000, down to 55% by 2019.
Now a passive index fund is characterised by a key feature: it buys at any price.
It does not look at valuations nor earnings reports. It does not really care whether price to earnings is 1x or 100x (or not have any earnings at all at the moment). It does not care about quality of management, business model.
It wants to go to Mars? Or it is selling cookies? It will buy the same amount if market capitalisation is the same.
To put it simply, if a $200 million market comprises of
Stock A valued at $100 million
and stock B valued at $100 million
The index fund’s exposure will be:
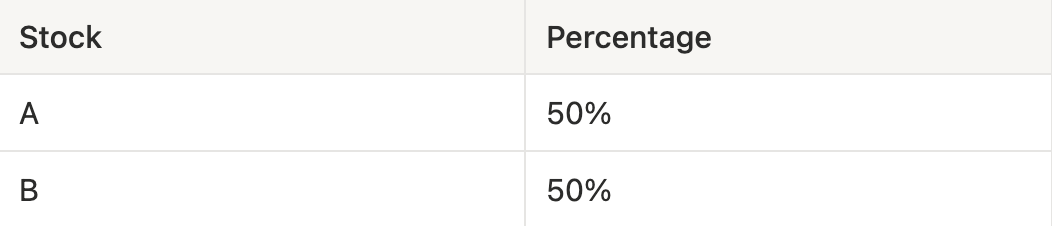
Despite the fact that stock A could be unprofitable trading at negative multiples or even without revenue. And stock B is already making tonnes of money, tried and tested to economic calamities and market crashes.
The index fund does not care. It just buys stock A and B altogether.
And justification is reasonable: extremely long investment horizon over 20 or 30 years, the entry price does not matter, so why bother?
Buying is also automated at the paycheque level
In the US, the moment John receives his salary, his 401(k) buys the index. Australia has superannuation, where employers must channel 12% of wage into retirement funds. The UK has auto-enrolment, where every employer is required by law to sign workers for a workplace pension. That is a minimum of 8% of earnings, flowing into a default fund, unless the worker actively opts out.
Pause and let these phenomenon sit in with you for a bit.
These things are happening in real time and these are massive pools of cash, regenerated monthly by the entire workforce of the developed world. And an ever-growing share of it is setup like that to buy automatically.
Now you might be curious, how big is this number?
Well, Americans hold $44 trillion in retirement accounts, of which $8.9 trillion is in 401(k)s. The fully-automated target-date funds was at about 8% of 401(k) assets in 2007. Today it is 38%.
And roughly 95% of younger workers’ contributions now default straight into them. In 2025, US passive funds took in $951 billion of net inflows while active funds had net outflow of $187 billion. US ETFs as a whole absorbed a record $1.48 trillion.
One single fund, Vanguard’s S&P 500 ETF (VOO), took in $124 billion in one year, an all-time record for any ETF. That is roughly half a billion dollars of buying, every single trading day, from one fund. VOO also became the first fund in history to cross $1 trillion in assets.
Add it all up and passive funds now hold 55% of all US fund assets, $19.4 trillion, up from 34% just a decade ago. Every year, the share of the market that cares about prices of individual equities shrinks, and the share that buys on autopilot grows.
Right so the autopilot demand is big, so what?
Well, circling back to the discussion on economics 101, the concern is that the market is exhibiting a behaviour like an inelastic good. And inelasticity has two consequences. Both of them are sitting right there in the data.
First consequence: it does not take much money to move the price.
When demand is inelastic, the curve is steep (see chart above if needed). Small changes in buying pressure produce large changes in price. Now, the entire US stock market is worth about $77 trillion. The net new money that flowed into passive funds in all of 2025 (an all-time high) was $0.95 trillion. Barely more than 1% of the thing it is holding up. Blue is the flow, grey is the stock.
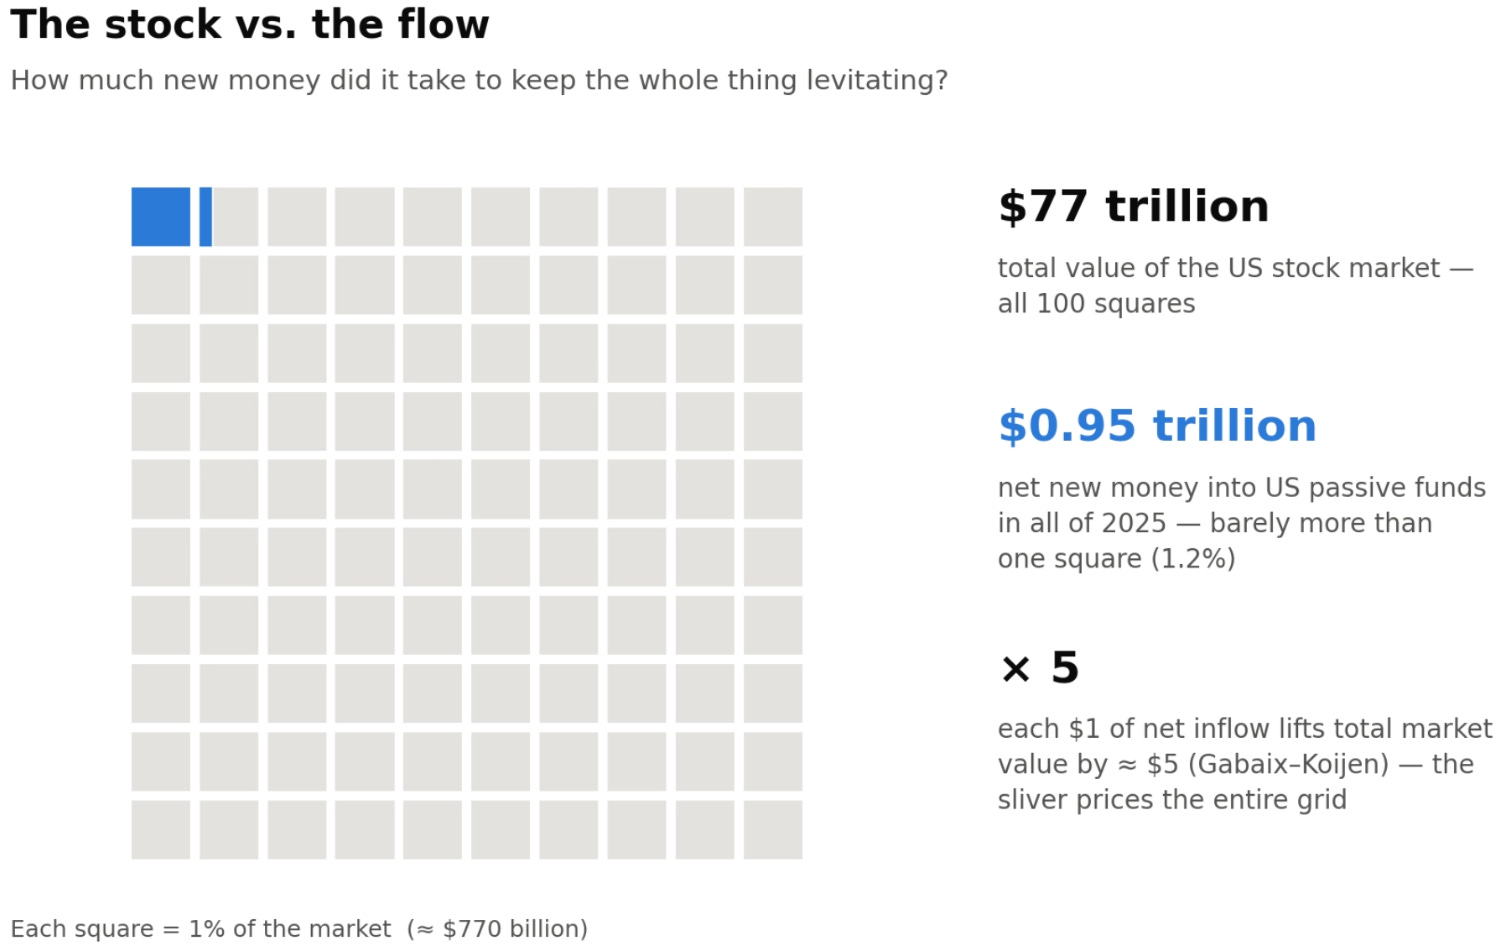
And remember, the research says each net $1 of inflow lifts total market value by roughly $5. The sliver prices the entire grid. That is what inelasticity does: when almost nobody on the other side of the trade reacts to price, the marginal dollar carries enormous weight.
Second consequence and this looks weird: the market appears to be breaking the law of demand entirely.
Run the elasticity test from your Economics 101 class: the delta of price against the delta of quantity demanded. In 2025, the price of this good went up by 16% (returns is 17.9% with dividends) in a single year. What happened to the quantity demanded?
For beef, an 16% price hike collapses quantity demanded by 16%.
For the S&P 500, demand did not fall at all. It sets an all-time record. 👏
Now, a sharp reader will object to my causality here (I have to be careful because you folks are smart).
“Toby, the price went up because people bought more. That is not a broken law of demand, that is just demand increasing (curve shifting to the right). Movement along the curve different from a shift of the curve. Econ 101.5, remember?”
And you would be right. But notice what makes this market different.
In a normal market, causality runs in a negative feedback loop. When buying pushes prices up, there is a negative feedback mechanism to have buyers to opt out from buying because of higher prices.
That is the feedback that keeps every other good on earth tied back to reality. Beef gets expensive, people buy chicken, beef price comes back down.
For the S&P 500’s marginal buyer, the behaviour is different. The buying moves the price. The price does not move the buying behaviour. In fact, John’s 401(k) does not consult the price at all.
And this is not me eyeballing one lucky year of data. The economists measured the response itself. How much does buying actually back off when prices rise? For the market as a whole, the measured answer is almost none.
The demand curve is getting more vertical not because 2025 was special, but because a growing share of the buyers are, by construction, incapable of reacting.
Which is exactly why the whole thing has been working as it is.
And it surely will go on forever, right?
I mean it is baked in to the wages of the workers who keep buying the S&P500. So as long as people are employed, S&P500 will keep going up right?
Well… I am afraid it is not that simple. But I will do my very best to explain it simply 🙂
Imagine the S&P500 as a water tank. It has a tap that fills it in with water (money flowing in as people buying the S&P500). Now lets not forget that it also has a drain (money flowing out as people selling the S&P500).
So it is relatively easy to imagine if
the tap > the drain
Price go up more in proportion to the inflow (remember it is inelastic).
If the tap < the drain
Price go down more in proportion to the outflow (remember it is inelastic).
What is the drain then?
The drain is retiree redemptions. At some point, the workforce that has been working for 40+ years will retire. They will cash out and try to sell the assets that have been going into their account regardless of the price.
America in particular, is in the middle of what researchers call the “Peak 65 zone”: roughly 11,400 Americans turn 65 every single day. That is roughly 4.2 million per year through 2027, the largest retirement wave in the country’s history.
And these are the baby boomers, the wealthiest generation ever, holding the largest share of these assets. The US tax code literally forces them to sell: required minimum distributions start at age 73, whether they like the price that day or not.
You can take a look at the visualisation below to wit.
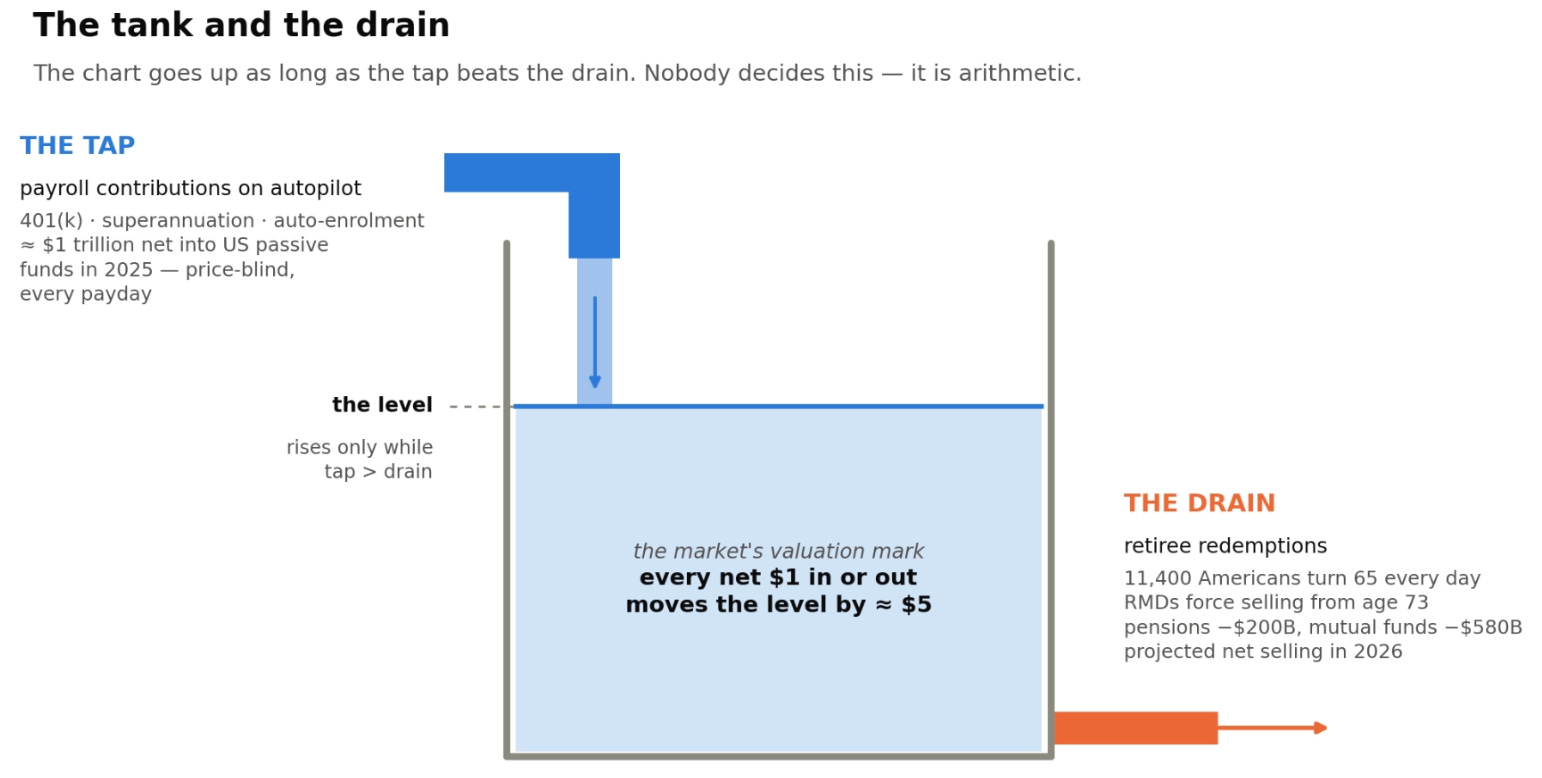
Furthermore, Goldman Sachs projects that in 2026, US pension funds will be net sellers of $200 billion of equities, and mutual funds will be net sellers of another $580 billion. For now the tap still wins: household and 401(k) buying outweighs the redemptions. But the drain side of the equation is not guaranteed to lose forever.
Of the top of my head, I can conjure up three events that can cause the drain to flow out faster than inflow from the tap.
Number 1: Recession
If unemployment rate increases, especially one that is driven by layoffs of high earning professionals, laid-off workers cash out their 401(k)s early to survive. During such an event, they’d need to buy groceries and they don’t really care if they are selling at a good or bad price.
Number 2: Foreigners heading home
Foreigners hold about 18% of the entire US stock market. They are quite fast moving too. In a few weeks around April 2025, foreign investors dumped an estimated $63 billion of US equities when Trump announced the unprecedented Tarriffs.
Number 3: Our good friend sentiment
Not all of the buying is automated through paycheques. Households buying ETFs in brokerage apps because the chart only goes up. Goldman pegs household buying at $520 billion for 2026, which is the single biggest source of demand.
If sentiment suddenly changes, and lets say household prefers emerging market index funds (which could happen overnight), then drain > tap.
Lets make the point more explicit
Which relates back to elasticity of demand. The S&P500 is an increasingly inelastic good said by smart geniuses in a relatively new paper. If that were to be true, this means that not only $1 in net inflow would cause $5 in increase in price. But also $1 net outflow would cause $5 in decrease in price.
Why? The price sensitive buyers would want to look for even more bargains before they start deploying capital. And the price sensitive buyers are getting fewer and fewer out there. The surviving ones likely will demand more bargains.
“So I have to stop buying the S&P 500? We get it Toby, you fearmonger”
Well, that is not what I am saying either. 🙂
I am not predicting a crash. I genuinely do not know when, or whether, the flows will flip. Nobody does which is rather the point. Demographics move glacially, governments can change rules anytime out of no where, and the machine could keep running for another month, year, decade or more.
The topic of discussion is narrower and, I think, more useful: to have a clearer picture of the engine behind the indices we are all buying.
Because I have personally seen many investors making an innocent looking but dangerous assumption:
“past performance, extrapolated from a chart, is a guarantee of future performance.”
without knowing what produced the past performance at all. We have seen how that movie ends, time and time again, in every era of market history.
Once you see the engine, you stop asking the unanswerable question:
“when will it stop?“
because I myself nor the smart ones nor the people in govt offices would know when.
A better and more useful answerable question (for you) is:
“am I well positioned for either outcome?“
You are still allowed to buy the index, everyone is. You are simply no longer allowed to believe that the returns it gives entails 0 risk.
There is always merit in seeing the risks in your investments, versus blindly investing because of a nice looking past performance chart.
Here is the irony to close: investing becomes less risky when we are well aware of the risks. It becomes more risky when we ignore them.
Thanks for reading all the way through! You now have a cool thing to say or two on your dinner table. Think your friends might find it useful? Go ahead and share it :)