

Disclaimer: Everything in this post is my personal opinion, written for educational purposes. It is not financial advice, and nothing here is a recommendation to buy, sell, or hold any security — or to hire or fire any particular advisor or fund manager. Track records, including the ones discussed here, do not guarantee future results. Please do your own research and consult a licensed professional before making investment decisions. And no, one good blog post is not a track record either.
In December 1989, Pete watched his favourite team lost to Crsytal Palace at Old Trafford. The manager from Aberdeen seemed promising at the start when he was signed to manage the club. But after 3 years being in charge, results didn’t show.
Pete decided that he has had enough of this manager. And he put up a banner demanding the club to sack the manager below.
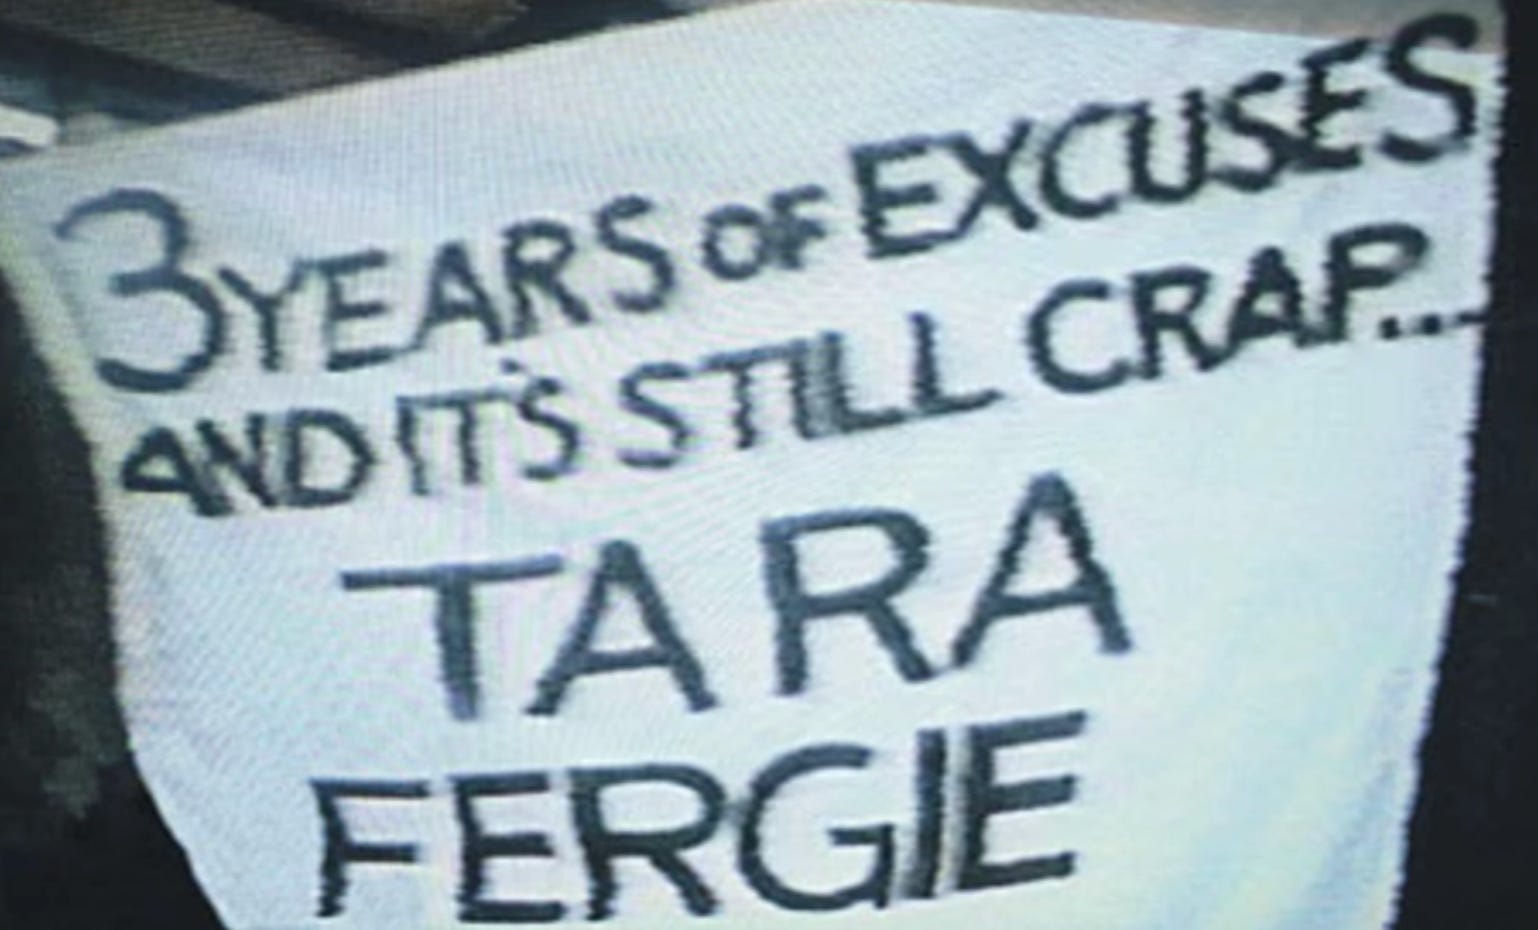
And of course, the manager is none other than Sir Alex Ferguson.
I couldn’t imagine if they actually went on to sack him. My childhood would probably be destroyed without Cristiano Ronaldo, Paul Scholes, Rio Ferdinand, Wayne Rooney and so many other man utd star players who won so many trophies in the decades that follow.
But to be fair to Pete, I understand how he was measuring Sir Alex. At that time, Man Utd was the club of Sir Matt Busby. Five league titles in the 50s and 60s. The Busby Babes. The first English club to lift the European Cup, in 1968. That was the bar at Old Trafford — and by 1989, United hadn't won the league in over two decades.
Would you have sacked him?
Be honest. Because after understanding the context as such, I would at the very least have considered it. So Pete is definitely not out of his mind. He probably just had the wrong sample size. And the wrong benchmark. Sound familiar?
Investing has the exact same disease
We do this to investors constantly. Someone posts +62% in a year and the group chat crowns them a genius. A fund underperforms for six quarters and clients pull their money. A friend's portfolio beats yours in 2025 and you quietly wonder if your entire approach is wrong.
And we anchor on golden eras too, just like the Old Trafford’s most faithful fans. The investor who made 40% in the 2021 bull run would be tempted to judge every year after against that number.
Let me make the parallel with football explicit, because it's not only serving a fun analogy — it's the same mathematical problem. The reason I opened with football at all is that somehow, in football, we all intuitively get this.
You wouldn't go to Manchester United today and ask for $300K weekly wages after you scored ONE beautiful bicycle kick against Jordan Pickford (England’s goalie). Everyone — the club, the fans, probably even your parents — can see that one moment of brilliance is not a career.
Yet in investing, one +62% screenshot in a group chat and we hand out exactly those wages: our trust, our money, sometimes our life savings.
Worse, in investing that one bicycle kick comes with a business model. A couple of multibagger screenshots and suddenly you have the license to sell ridiculously priced investment courses — screenshots that conveniently leave out every item that would describe your true skill.
The losing positions.
The size of the bet.
The risk taken.
The years before and after.
It is also somehow intuitive to understand that in football, every single match result contains randomness. A deflected shot. A wrongly disallowed goal. The opposition striker having the game of his life. The better team loses all the time.
Investing is identical. There is a degree of randomness baked into every investment outcome at a point in time. The stock you bought went up — was that your thesis playing out, or a flood of liquidity lifting everything? The fund that beat the index this year — genuinely insightful, or one lucky concentrated bet? At any single point in time, skill and luck can produce the exact same looking number. You cannot tell them apart from one outcome alone.
Which means that if you evaluate an investor over a short window, you are not necessarily seeing skill. This is because you could be measuring an outcome from pure randomness.
So the natural question: how short is short? And how long is long enough?
A quarter is noise. A year is a single draw from the distribution. Even three years can be one uninterrupted bull run, which I believe, is the least informative environment there is. Here football actually has it easier: a manager gets 38 data points every season. An investor's true "season" — a full market cycle, from euphoria to panic and back can take years to complete.
And that’s the real answer. The minimum honest sample is not a number of years but at least one full trip through a good market and a bad one. In practice that usually means at least 3 years. Not because five is magic, but because that’s roughly how long the market takes to hand out both exams.
Why both? Because there’s a second problem, one almost everyone misses: in investing, the score alone is not the score.
Shape of returns
In The Most Important Thing, Howard Marks has a chapter called “Adding Value” that explains clearly how people can evaluate investors.
He sketches four types of investors, along two dimensions: how aggressive their style is, and whether they actually have skill. It’s worth drawing out, because once you see the quadrant, you can never unsee it:
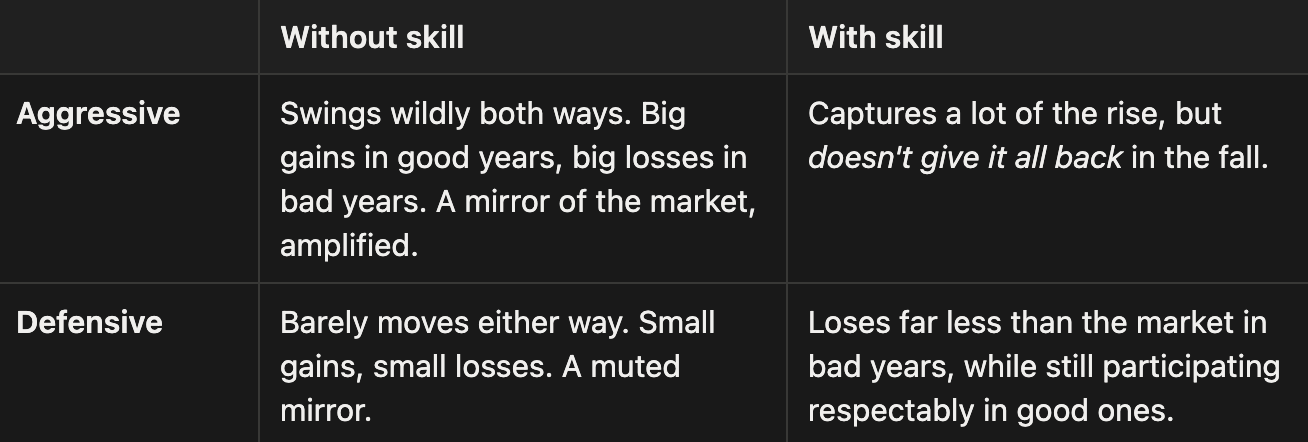
Here’s the punchline of the quadrant: the left column is not adding anything. The aggressive investor without skill isn’t bold, he’s just turned the dial up. The defensive one without skill isn’t prudent, he’s just turned the dial down. In both cases the market is doing all the work, and their results are just the market’s results passed through a volume knob.
Skill only becomes apparent on the right column. And notice what both right-column investors have in common: their good years and bad years are not symmetrical.
Howard Marks compresses it into one line:
“The performance of investors who add value is asymmetrical. The percentage of the market’s gain they capture is higher than the percentage of loss they suffer.”
Let me make that concrete with numbers, because “asymmetry” is abstract until you see it.
Suppose the market goes up 20% in good years and drops 20% in bad ones.
Investor A returns: +30% and −30%.
Investor B returns: +25% and −10%.
Look at Investor A. Impressive on the way up! Probably there’s a multibagger stock in his portfolio that he could screenshot to claim that he’s a good investor. But if you consider his performance during bad years, he also sees 150% of the market loss.
That’s the top-left box: no skill, just a dial.
Investor B captures 125% of the upside but only 50% of the downside.
That gap — between his up-capture and his down-capture — is skill. It’s the only place skill can reliably be seen.
So when we say skill is a shape, it is not the height of any single year’s return, but the relationship between the good years and the bad years across the whole record. A +40% year, on its own, cannot tell you whether you’re looking at Investor A or Investor B. You need the pair.
For many, the bad year is the exam
This is why, counterintuitively, the most informative moment in an investor’s track record is not their best year. It’s their worst one.
Bull markets grade everyone an A. When the whole market is up 30%, the skilled and the reckless are indistinguishable — in fact, the reckless usually look better, because recklessness is rewarded on the way up.
Then a 2008 arrives. Or a March 2020. Or a black swan nobody modelled.
The crisis year is the single clearest picture of skill you will ever get, because it’s the one year where the market isn’t doing the work for anyone. The investor who was up 40% and then down 60% was never skilled — you just hadn’t seen the second half of the shape yet. The investor who captured most of the rally and only a fraction of the crash? That asymmetry is nearly impossible to fake.
So what do you actually do with this?
None of this means you should lower your standards. Quite the opposite.
You want high standards when you work with people, especially people who sees your money. Think about how you hire. Before anyone joins your team, there’s a set of criteria and a set of deal breakers. You don’t hand someone the job because they had one great interview, and you don’t reject them because they stumbled on one question. You assess the things that actually predict whether they’ll do the job well.
Evaluating an investor deserves the same rigour.
So here are the four criteria I’d actually have, whether you’re evaluating a fund manager, an advisor, a finfluencer with a screenshot, or your own portfolio.
How long is the sample? One year is one sample drawn. Anything under a full market cycle is more like an audition, not a track record. Ferguson needed four years before the evidence turned. Your judgment of an investment approach deserves at least that much patience.
What happened in the worst year? Don’t ask for the best return. Ask for the worst one, and what the market did that same year. This single question filters out more noise than any other.
What risk was taken to get the return? Two portfolios that both returned 15% are not equal if one was concentrated in speculative small-caps and the other held boring cash-generating businesses. The return you can see; the risk you have to ask about.
How do they measure against you? Measure their performance against your own. If you could do better yourself — honestly, over the same period, with real money at stake — why bother having an advisor or a fund manager at all?
One warning about this test though: we are often biased graders of our own performance. We remember the wins vividly, quietly dismiss the losses, and prioritise looking good over actual CAGR. Ask someone their portfolio return and you’ll usually get their best year; ask for the full audited number and the room becomes silent.
The good news is there’s a non-biased way to do it, and it’s not complicated. Pull your own account statements. Account for every top-up and withdrawal — money you added is not return, no matter how good it feels watching the balance grow. Construct your Net Asset Value over time, the same way a fund would. Then compute the actual CAGR of your portfolio. Not the CAGR of your favourite position. The whole portfolio, cash drag and losers included.
If that number beats the track record of the advisor or fund manager you’re evaluating, then hiring them makes less sense — unless what you’re really buying is time, so you can focus on something else altogether. (Which, by the way, is a perfectly legitimate reason. Just be honest that it’s the reason.)
But here’s the thing about skipping this exercise and grading yourself from memory: sooner or later, it does its owner (you) a disservice. Inflating your own scorecard doesn’t harm the advisor you dismissed or the fund you never joined. It really will not harm anyone but yourself — you’ll keep managing money you shouldn’t be managing, benchmarked against a track record that never existed.
This is, incidentally, why we built Recompound around long-horizon accountability rather than quarterly performance assertions. When your advisor’s incentive is tied to your outcomes over years. The asymmetry stops being a nice idea in a book and becomes the actual goals in place.
The banner guy at Old Trafford wasn’t stupid. He just judged a 26-year story on a 3-year sample.
If someone in your circle is currently crowning (or crucifying) an investor based on one year of returns, perhaps this article could be useful 😉. It might save them from a costly mistake.
Cheers!